Politics & Government
Elections Results for Murrieta Are Here
Get all your Election Day 2012 coverage from Murrieta Patch.


Updated at 7:50 a.m. Nov. 7:
Check Patch for ongoing coverage of all the races that affect Murrieta.
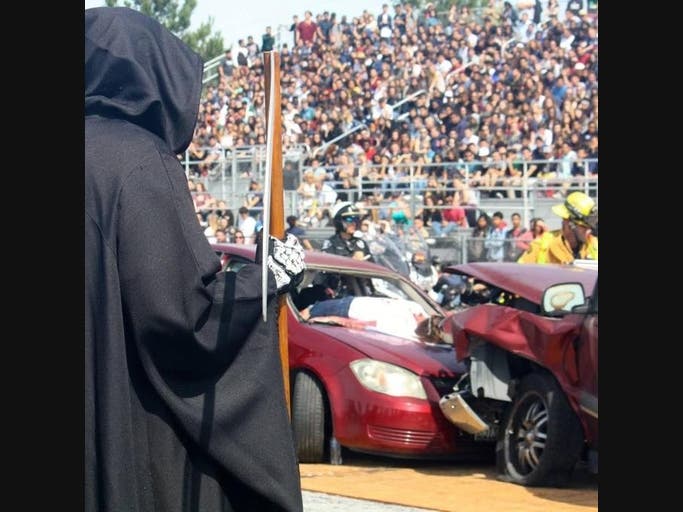
PHOTOS: Murrieta votes
Find out what's happening in Murrietawith free, real-time updates from Patch.
The latest updated Riverside County elections results were posted just after 7:30 a.m. Wednesday.
"Election Night vote counting is complete, but results are not final. Information regarding provisional, vote-by-mail, and damaged ballots that require duplication and remain to be counted will be posted shortly," the registrar's office said via its Facebook page.
Find out what's happening in Murrietawith free, real-time updates from Patch.
Here are the latest results for races affecting Murrieta:
LOCAL Results as of 7:33 a.m. Nov. 7:
- Murrieta City Council, Two Seats (Candidates Paul Clay 18.75 percent, Dan Strick 4.14 percent, David Mueting 5.86 percent, Harry Ramos 23.16 percent, Randon Lane 36.26 percent and Joel Phillips 11.83 percent)
- Murrieta School Board, Three Seats (Candidates Margi Wray 18.30 percent, Ken Dickson 19.63 percent, Paul Diffley 22.79 percent, Barbara Muir 20.34 percent and Gregory Lee 18.94 percent)
- MSJC Trustee, Area 5 (Candidates Tom Ashley 65.35 percent and Guy Romero 34.65 percent)
- Measure N: A yes vote bans red-light cameras from Murrieta; a no vote keeps them in place. YES: 57.20 percent; NO: 42.80 percent.
STATE and FEDERAL:
- (This post will be updated continually once results start coming in.)
STATE PROPOSITIONS:
- The results will be posted here as they come in.
How will Murrieta Vote?
Here is a breakdown of the changes seen in how Murrieta voters registered in 2012 versus 2008:
There were 48,587 registered voters within the city of Murrieta, according to the Riverside County Registar of Voters' Oct. 31 count—a 9.7 percent increase from the 2008 presidential election when there were 44,279 registered Murrieta voters.
The largest contingency—48.2 percent—of Murrieta voters are registered Republican, though that is down from 50.64 percent in 2008, according to figures from the Registar's office and the state controller's website.
Those who registered as Democrat make up 25.35 percent of Murrieta voters, down from 26.28 percent four years ago.
Those who declined to state a party preference numbered 20.67 percent of Murrieta voters, up from 19 percent in 2008.
The next largest contingency of Murrieta voters—3.54 percent—registered as American Independent Party. Smaller numbers registered with Green, Liberatarian, Peace and Freedom and other parties.
Countywide, the number of registered voters increased 12.6 percent, from 837,389 in 2008 to 943,405 as of Oct. 31.
Forty percent of county voters this year are registered Republican, while 36 percent are Democrat and 17.9 percent declined to state a party preference.
Get more local news delivered straight to your inbox. Sign up for free Patch newsletters and alerts.